TL;DR
Technology Architecture artifacts describe the baseline and target technology landscape. Common Phase D artifacts include the Technology Portfolio Catalog, Platform Decomposition Diagram, and Environments and Locations Diagram.
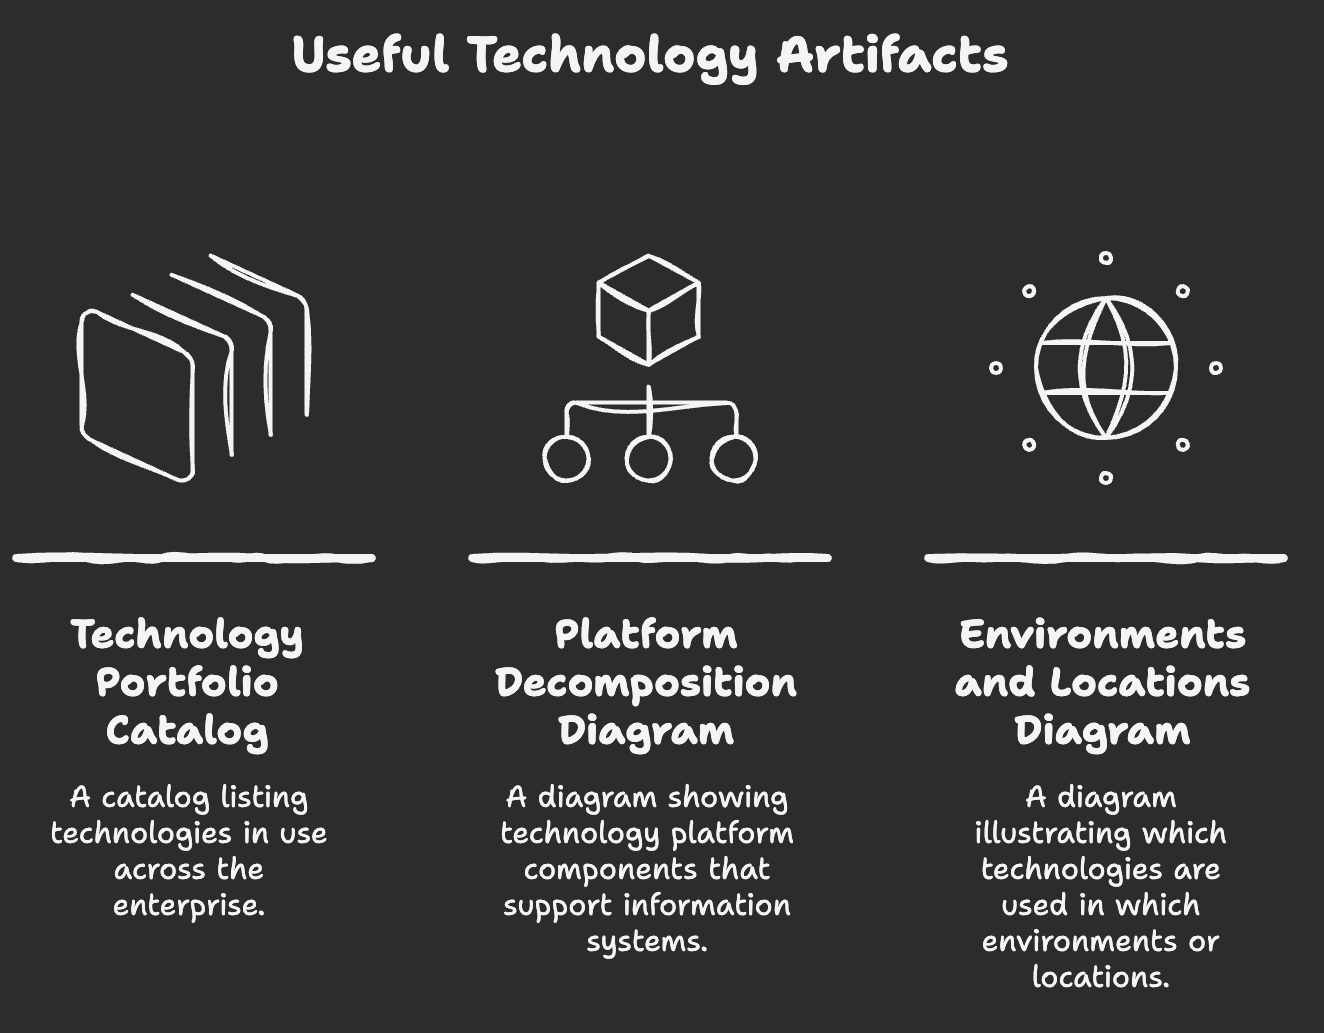
Useful technology artifacts
TOGAF lists several catalogs, matrices, and diagrams that may be used for Technology Architecture.
The visual below highlights three useful examples. The sections that follow explain how each one is used.
Technology Portfolio Catalog
The Technology Portfolio Catalog is a common starting point for baseline and target Technology Architecture.
It lists technology in use across the enterprise, including:
- hardware
- infrastructure software
- application software
- platform services
- technology services
Typical fields:
| Field | Meaning |
|---|---|
| Logical technology component | Technology capability or component independent of a specific product instance |
| Description | Short explanation of what the technology does |
| Acquisition date | When it was acquired or introduced |
| Category | Technology grouping, such as automation, platform, network, operating system, or storage |
| Lifecycle status | Current, target, retired, planned, or replaced |
Example:
| Logical technology component | Description | Acquisition date | Category | Lifecycle status |
|---|---|---|---|---|
| Workflow Automation | Automates repetitive tasks and processes | 2022 | Automation | Current |
| Application Connectors | Connects applications and services | 2021 | Integration | Current |
| Event Triggers | Starts actions based on defined events | 2023 | Integration | Target |
| Subscription Services | Manages event subscriptions and notifications | 2023 | Platform service | Target |
An agreed technology portfolio supports technology lifecycle management and helps define technology standards.
It also provides a data source for other Technology Architecture artifacts.
Platform Decomposition Diagram
The Platform Decomposition Diagram shows the technology platform that supports the operation of the Information Systems Architectures.
flowchart TD
    BPA["Business Process Automation Platform"]
    BI["Business Intelligence Platform"]

    BPA --> AC["Application Connectors"]
    BPA --> ET["Event Triggers"]
    BPA --> SS["Subscription Services"]
    BPA --> WA["Workflow Automation"]

    BI --> DW["Data Warehouse"]
    BI --> DI["Data Integration"]
    BI --> RS["Reporting Services"]
    BI --> AE["Analytics Engine"]
The diagram may show:
- technology components in a platform
- how platforms support application components
- infrastructure platform structure
- specification details such as product versions, CPUs, or deployment details when needed
- an informal overview of the technical environment
Keep the level of detail tied to the stakeholder concern. Too much technical detail can make the artifact hard to maintain and hard to read.
Environments and Locations Diagram
The Environments and Locations Diagram shows which technologies are used in which environments or locations.
It may show:
- operating systems by location
- network components by location
- infrastructure services by environment
- outdated technologies that need upgrades
Example:
| Location | Environment | Operating system | Status |
|---|---|---|---|
| London | Production | Linux 8 | Current |
| Mumbai | Production | Linux 7 | Upgrade needed |
| Singapore | Test | Windows Server 2016 | Upgrade needed |
| New York | Development | Linux 9 | Current |
This kind of view is useful when technology risk depends on location, environment, version, or support status.
Exam note
- Technology Architecture artifacts are created in Phase D.
- The Technology Portfolio Catalog lists technologies in use across the enterprise.
- The technology portfolio supports lifecycle management and technology standards.
- The Platform Decomposition Diagram shows the technology platform that supports information systems.
- The Environments and Locations Diagram shows which technologies are used in which locations or environments.
- Technology artifacts should show enough detail for the concern being addressed.